


Windguest #2 - Understanding wind resource (II)
The evaluation of wind resources, key to the development and financing of wind farms: horizontal extrapolation, power curve, wakes, losses, and uncertainty.


Hello everyone and welcome to a new issue of Windletter. I'm Sergio Fernández Munguía (@Sergio_FerMun) and here we discuss the latest news in the wind power sector from a different perspective. If you enjoy the newsletter and are not subscribed, you can do so here.
Windletter is sponsored by:
🔹 Tetrace. Specialized services in operation and maintenance, engineering, supervision, inspection, technical assistance, and distribution of spare parts in the wind sector. More information here.
🔹 RenerCycle. Development and commercialization of solutions and specialized services in the circular economy for renewable energies, including comprehensive dismantling of wind farms and waste management, refurbishment and sale of components and wind turbines, management and recycling of blades and others. More information here.
Windletter está disponible en español aquí
As you already know, from time to time, we bring guest contributors to Windletter, allowing us to cover new topics explained by experts in the sector.
Today, we continue with the second part of the article series by Alberto Quintana Infante, Head of the Wind Resource Area at Hanwha Energy Corporation Europe. Alberto explains the fundamentals of wind resource analysis.
To read this article, it's important to have read the first part beforehand. Check your inbox or read it here.

I’ll leave you with Alberto.
🌬️ Understanding wind resource: horizontal extrapolation, power curve, wakes, losses, and uncertainty
After analyzing wind measurements, long-term estimation, and vertical extrapolation in the first part, we now move on to:
➡️ Horizontal extrapolation
📊 Power curve and wind turbine model
🌪️ Wake models
📉 Technical and operational losses
❓ Variability and uncertainties
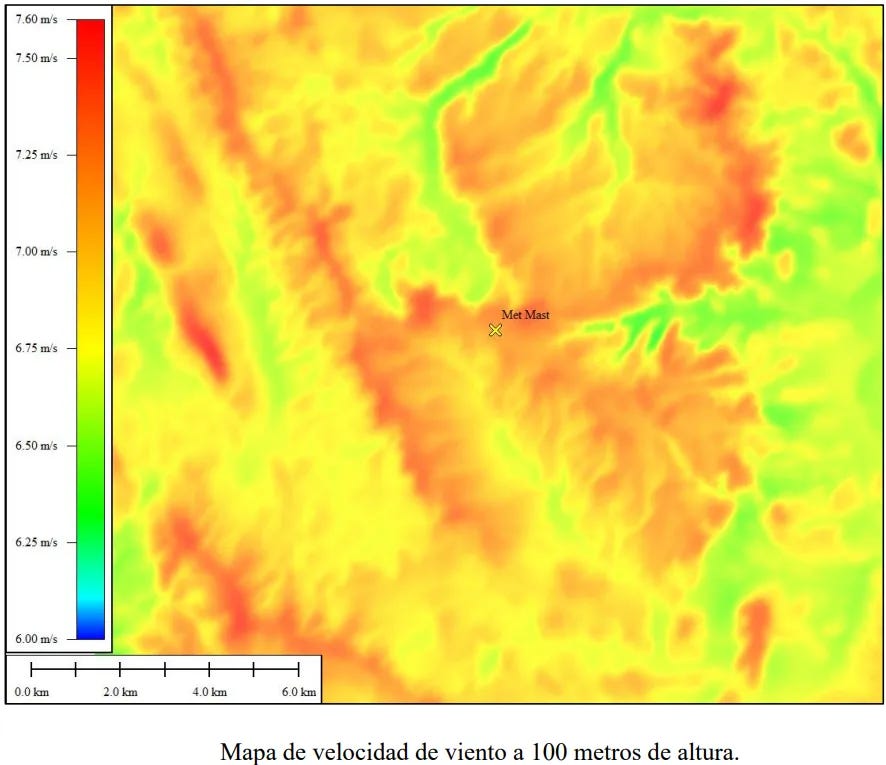
➡️ Horizontal extrapolation
We’ve already measured at least one point of the site (where the measurement tower or towers have been installed), but how do we determine the wind speed at every turbine location in the wind farm?
This is another critical step, and choosing the right modeling software to generate the wind map for the area is essential. It’s important to input terrain information (orography, roughness, obstacles, etc.) with as much detail as possible. These maps will allow for the optimization of the turbine layout and provide insights into areas with energy potential.
Analyzing terrain complexity is also crucial since it may require specific models (e.g., CFD) capable of characterizing highly complex sites. However, modeling doesn’t always hit the mark. To improve confidence in the results, additional measurement towers or campaigns with SODAR/LIDAR devices running parallel to the main tower may be needed, especially if the project area is extensive.
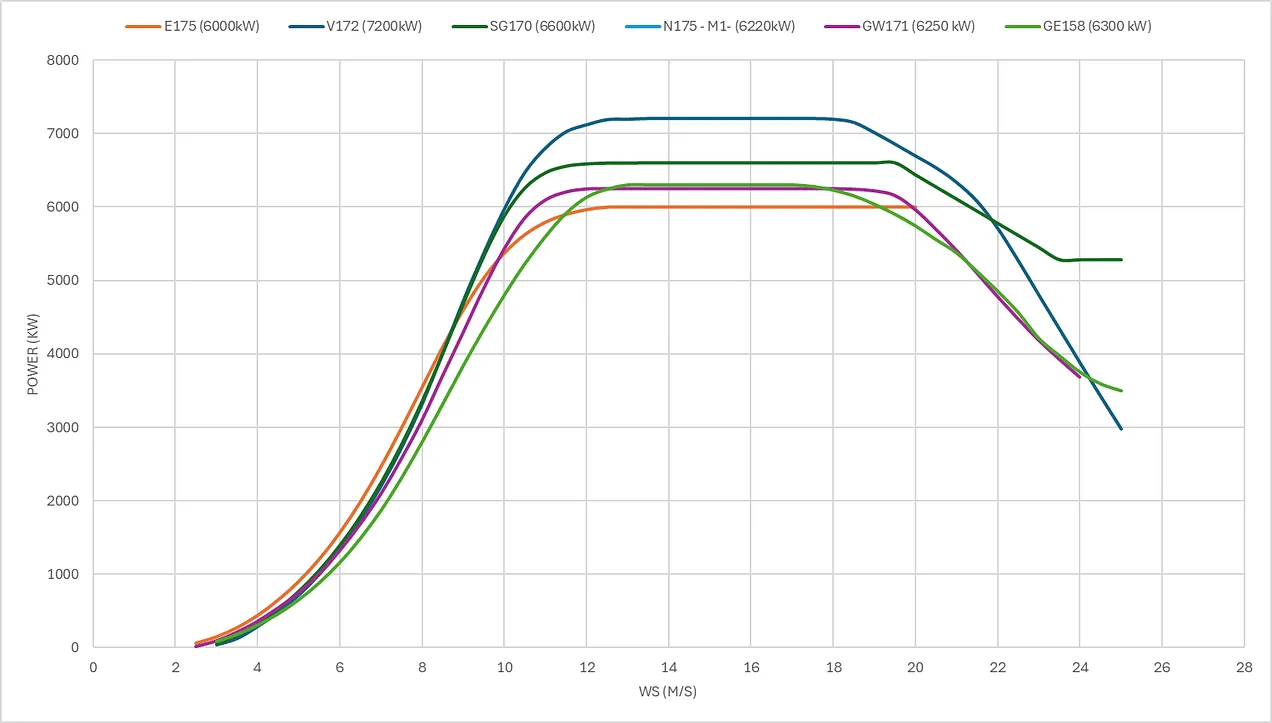
📊 Power curve and wind turbine model
At this stage, the key question is: how do we transform wind measurements into energy production? This is done using the power curve provided by the turbine manufacturer.
Two key points: adapting the curve to the site’s air density (which requires measuring variables like temperature and atmospheric pressure) and selecting the appropriate wind turbine model. This involves assessing factors such as the turbine’s Class and Subclass, which determine the suitability of a turbine for a specific site.
Permitting constraints can sometimes complicate this process, as limitations on tip height, rotor size, or turbine spacing can reduce flexibility when switching models or manufacturers. Additionally, reprocessing permits for a turbine change can cause unacceptable delays for the project.
🌪️ Wake models
The effects of operating turbines on the wind flow are complex. How does the airflow redistribute after passing through the rotor?
It’s well-established that closely spaced turbines affect each other. Analyzing these phenomena is no easy task.
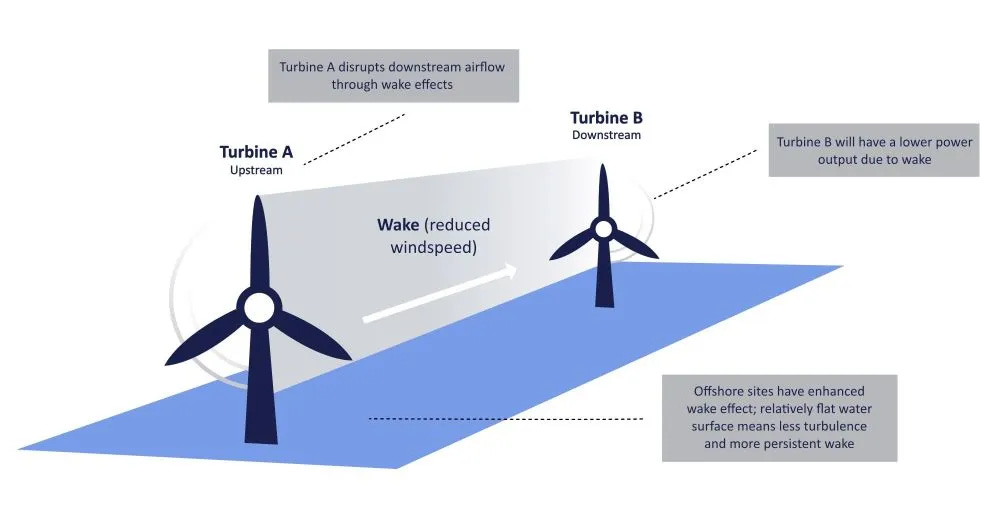
Various numerical models aim to calculate the speed reduction caused by this effect, known as the wake effect. Some names to keep in mind include Jensen, PARK, or Large Eddy Simulation (LES) models, which are also used to simulate turbulence generated by wakes. Each has its own limitations, advantages, and drawbacks.
📉 Technical and operational losses
Production estimates must consider potential losses to deliver realistic results. What types of losses can we encounter beyond plant availability or electrical transmission?
Losses can be grouped into three categories:
Turbine performance:
Deviation from the theoretical power curve.
Hysteresis at high wind speeds.
Inclined flow or rotor misalignment with actual wind direction.
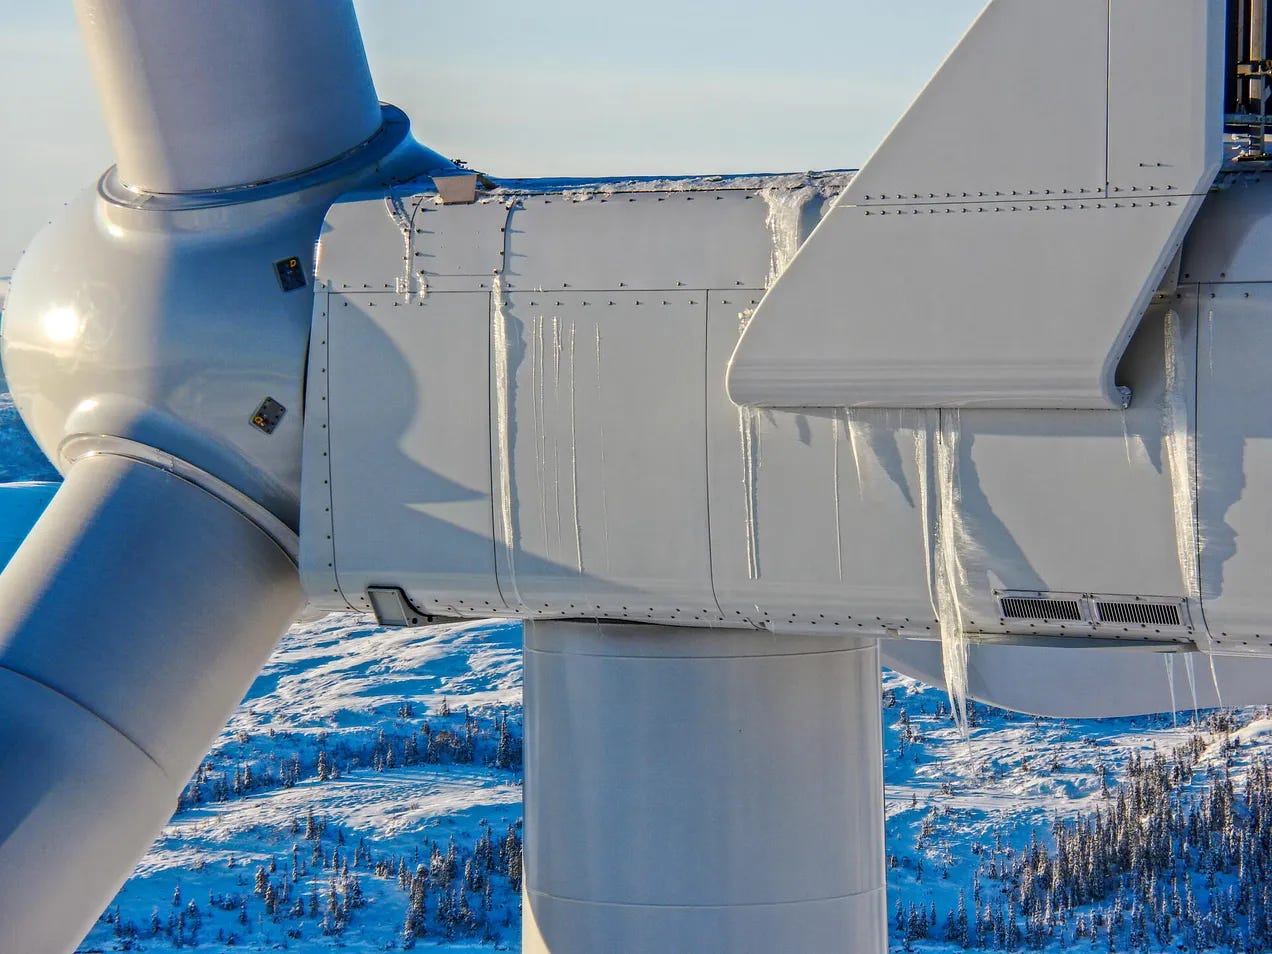
Environmental factors:
Blade degradation from dirt or ice formation.
Operational temperature ranges.
Derating.
Operational restrictions:
Temporary noise constraints.
Shadow flicker.
Birds or bats.
Wind sector management.
Power limitations or curtailments.
❓ Variability and uncertainties
All the variables and calculations discussed in both articles involve uncertainties that must be correctly assessed and quantified. Since the ultimate goal is to understand energy production and make investment decisions, all the analyses above are essential to minimize project risk.
How are uncertainties in calculations evaluated?
Even if the P50 estimate is perfectly defined, wind farm energy production varies yearly due to factors like the natural variability of the wind regime, system availability changes, or fluctuations in technical losses as described earlier.
Net energy uncertainty provides a metric for determining the risk of a project’s production decreasing or increasing over a specific period (typically 1 year, 10 years, or the project’s lifetime). To determine this, uncertainties related to wind speed data and models, energy loss factors, and interannual production variability must be considered.
These factors, combined with the site’s specific sensitivity to wind speed, are used to generate a probability distribution for the project’s annual net energy production. Probabilistic stochastic processes are the most complex methodology but offer the best characterization of randomness in each variable.
All these evaluations and measurement campaigns should aim to improve estimation quality and minimize overall project uncertainty, which is critical for justifying financing.
Park sensitivity determines how production responds to changes in wind speed. Similarly, wind speed uncertainties translate into energy uncertainties using this parameter, which depends mainly on wind speed distribution and the turbine’s power curve. For example, with a sensitivity of 2, a 2.0% reduction in wind speed would result in a 4.0% reduction in net energy production.
✅ Conclusions
To conclude, it’s worth emphasizing that each stage is important and impacts the results and the final uncertainty assessment, with the quality of the measurement campaign being the key starting point for the studies.
Each section could undoubtedly warrant more than one article, so if this has been of interest, we can dive deeper into any of them.
Read other guest contributors:


Thank you very much for reading Windletter and many thanks to Tetrace and RenerCycle, our main sponsors, for making it possible. If you liked it:
Give it a ❤️
Share it on WhatsApp with this link
And if you feel like it, recommend Windletter to help me grow 🚀
See you next time!
Disclaimer: The opinions presented in Windletter are mine and do not necessarily reflect the views of my employer.