


Windstory #16 - Analysing global wind power figures in 2024
The world installed 117 GW of wind capacity in 2024, just slightly above 2023. China accounted for 68% of it.


Hello everyone and welcome to a new issue of Windletter. I'm Sergio Fernández Munguía (@Sergio_FerMun) and here we discuss the latest news in the wind power sector from a different perspective. If you're not subscribed to the newsletter, you can do so here.
Windletter is sponsored by:
🔹 Tetrace. Reference provider of O&M services, engineering, supervision, and spare parts in the renewable energy market. More information here.
🔹 RenerCycle. Development and commercialization of specialized circular economy solutions and services for renewable energies. More information here.
🔹 Nabrawind. Design, development, manufacturing, and commercialization of advanced wind technologies. More information here.
Windletter está disponible en español aquí
Before we begin, I’d like to ask you a small favor. The team at the Spanish media El Periódico de la Energía has kindly nominated me for the “Best Energy Communicator” award, which will be presented at their annual event: La Noche de la Energía (The Night of Energy).

For me, it’s a real honor to be included on this list, surrounded by top-level professionals and people I read, follow, and admire. This nomination, regardless of the outcome, is already far more recognition than I deserve. The winner is decided by public vote, so if you’d like to support me and help bring the name of Windletter to the top, I’d be thrilled to have your vote through this link.
It only takes about 30 seconds to vote and the process (using Google Translate, for non-Spanish speakers) is as follows: just enter your email address in the form at the link above. Then, you’ll receive an email with a link where you can cast your vote. Thank you so much in advance to all of you!
P.S.: I think it’s finally time to get some new photos taken 😂
Today we bring you a new Windstory, the article section of Windletter, where we publish single-topic analyses and share interesting stories from the wind energy sector. From time to time, without a set schedule, a new edition of Windstory will arrive in your inbox.
🌍 Global Wind Energy Report 2025
Every year, the Global Wind Energy Council, the worldwide wind energy association, publishes a report that compiles the sector’s data and statistics from the previous year, including figures, challenges, and future outlooks.
It’s a detailed and comprehensive report, with over 100 pages covering key sector topics such as investment and financing, supply chain, grid integration, social impact… and of course, numbers, lots of numbers. Honestly, I consider it one of the best official sources to understand the wind sector at a global scale.
We’re using this edition to go over the main highlights of the report, just as we did last year.
🌬️ The world installed 117 GW of wind power in 2024. China installed 68% of it
▶ The world installed 117 GW of new wind capacity in 2024, just 0.4 GW more than in 2023, representing a growth of only 0.3%. This figure falls well short of GWEC’s forecast, which estimated 130 GW for the year.

▶ By the end of 2024, global wind capacity reached 1,136 GW. From 2023 to 2024, the sector grew by 11%. 2024 was also the year in which onshore wind surpassed 1,000 GW of installed capacity worldwide.

▶ The top 5 countries for new installations are the same as last year, though with some changes in ranking. They are China, the United States, Germany, India, and Brazil. Together, they account for 82% of global installations.

▶ The five countries with the highest total installed wind capacity are again China, the United States, Germany, India, and Brazil. The latter has overtaken Spain to claim fifth place. Combined, these five countries represent 73% of the world’s total wind capacity.

▶ The strong growth of China and the recovery of India have consolidated the dominance of the Asia-Pacific region, which now holds a 75% share of the global market and saw 7% year-on-year growth. It’s worth noting, however, that in many publications India is considered a separate region. Grouping China and India into one region combines two massive markets.
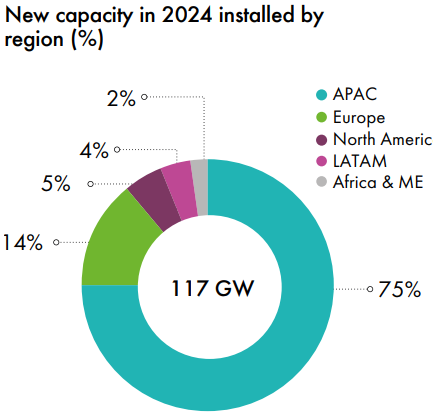
▶ Europe installed 16.4 GW in 2024 (12.9 GW in the EU-27). Despite a 10% drop in new installations and a 2% decrease in global share, it remains by far the second-largest regional market worldwide. North America rounds out the top three with 5% of global installation


▶ For the second consecutive year, onshore wind surpassed the 100 GW mark, reaching a historic peak of 109 GW. However, the offshore sector dropped to 8 GW, 26% less than in 2023 (10.8 GW) and the lowest figure since 2020.

Once again, it's worth highlighting that, despite offshore being the trendiest technology and receiving most of the spotlight (perhaps even Windletter is a bit guilty of this, it’s something I’m reassessing), onshore wind remains the true protagonist and main driving force of the sector.
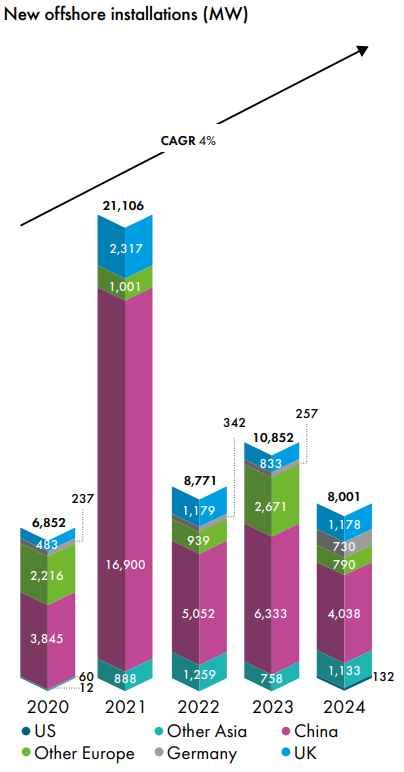
▶ China leads offshore for the seventh year in a row with 4 GW of new installations. It now totals 41.8 GW offshore nearly half of global installed capacity. Since 2022, newly built wind farms (both onshore and offshore) in China receive the same tariff as coal-fired plants, a system known as grid parity.
The United Kingdom remains strong in second place, with Taiwan as the third-largest market. France and Germany complete the top 5.
▶ A total of 41.8 MW of floating wind was installed worldwide. Provence Grand Large, with 3 SG 8.0-167 DD turbines of 8.4 MW each, and OceanX, Mingyang’s dual-rotor prototype.

▶ In 2024, 56.3 GW of offshore wind capacity was awarded globally. Excluding China, where 17.4 GW were awarded under the grid parity system, the remaining 38.4 GW were awarded in Europe (23.2 GW), the United States (8.4 GW—though it remains to be seen how many move forward), South Korea (3.3 GW), Taiwan (2.7 GW), and Japan (1.4 GW).
▶ Of all the offshore capacity awarded in 2024, 1.9 GW corresponds to floating wind:
🇫🇷 France: 750 MW awarded in the AO5 and AO6 tenders, spread across three floating projects.
🇰🇷 South Korea: 750 MW for the Firefly project.
🇬🇧 United Kingdom: 400 MW for the Green Volt project, in the CfD Allocation Round 6.

▶ The following chart shows the historical record of annual new installations and gives us an idea of how the sector has grown over the past 25 years. As can be seen, the growth rate is slowing down—something expected when talking about a mature technology.
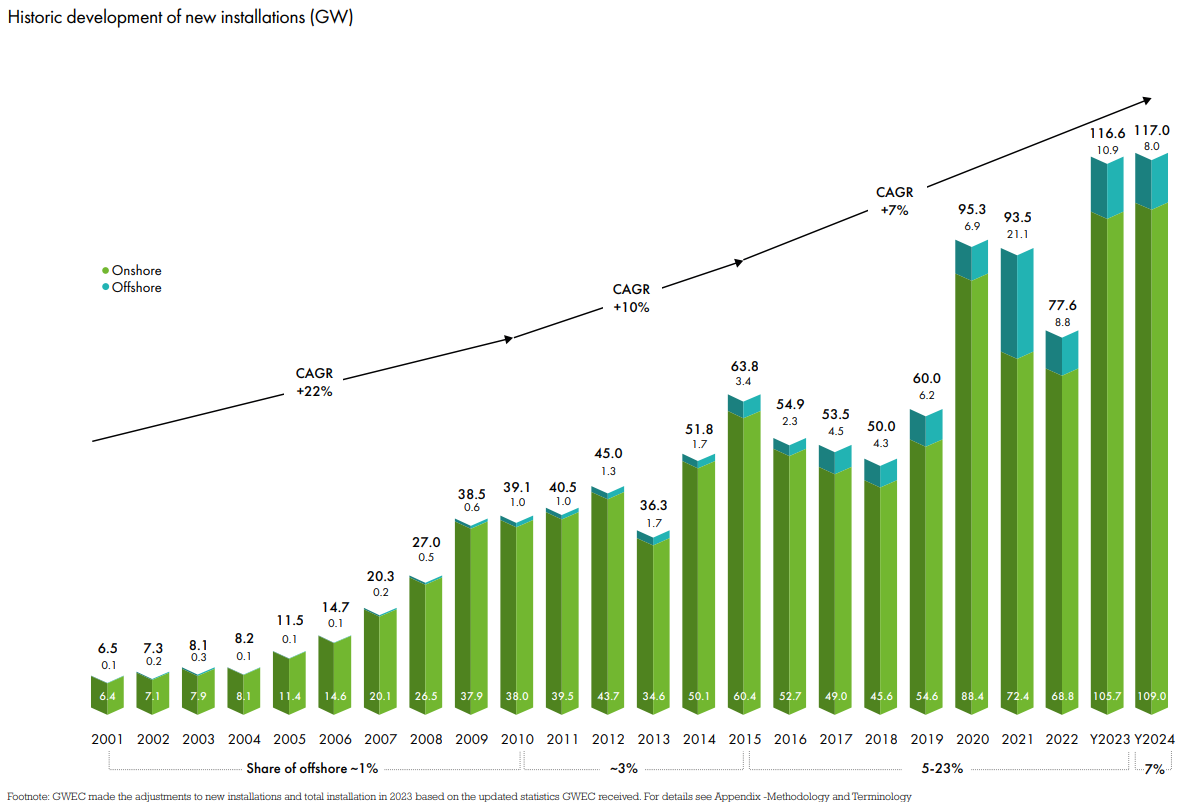
▶ For this year 2025, GWEC expects new installations to surpass the previous record with 138 GW installed. The amount of installed GW would continue increasing, reaching 194 GW by 2030.


▶ In a separate press release, GWEC published some data on OEMs that I found very interesting.
In 2024, a total of 29 manufacturers installed (mechanically erected, though not necessarily commissioned) 127 GW worldwide.
Those 127 GW correspond to 23,098 wind turbines.
The 29 OEMs (I’m not entirely sure where so many come from) are divided as follows:
18 manufacturers from Asia-Pacific
8 from Europe (do we really have that many in Europe?)
2 from the Americas
1 from the Middle East
They also included the following chart (X-axis: installation volume, Y-axis: number of markets), from which some interesting conclusions can be drawn:
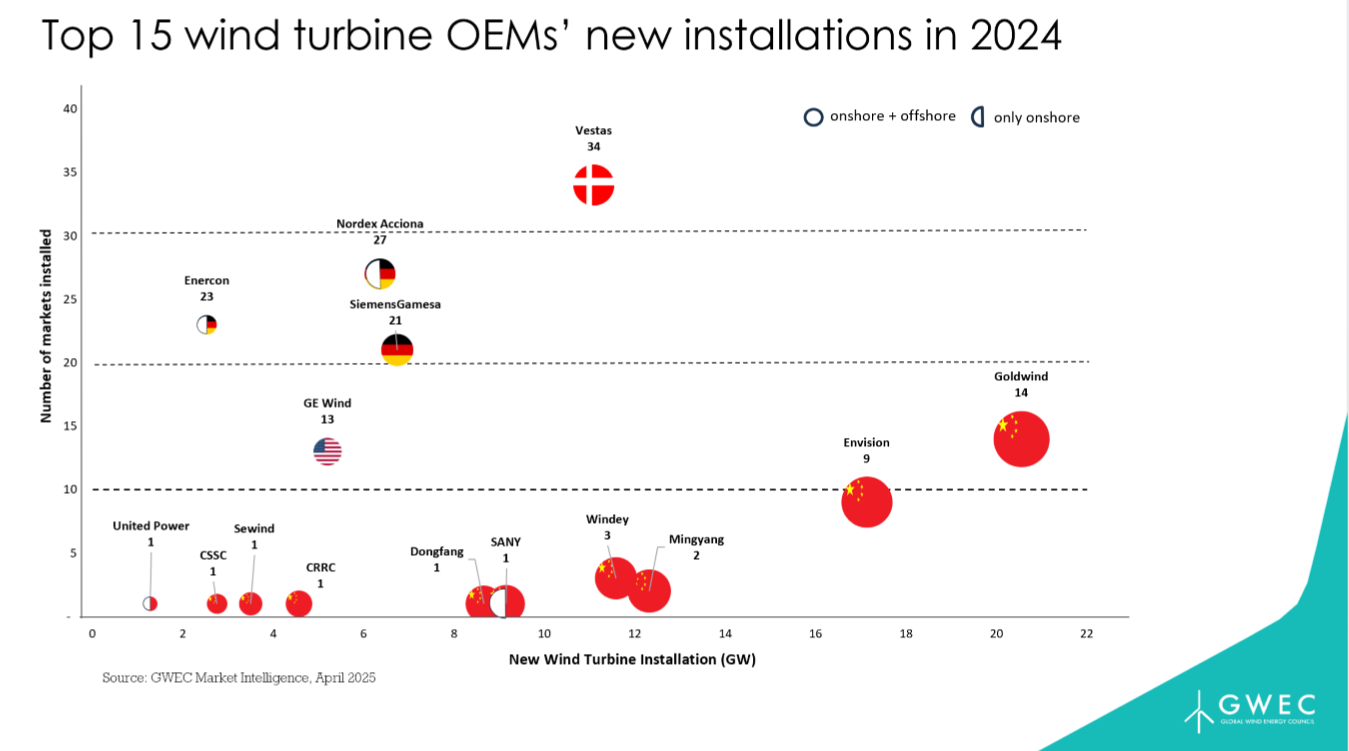
Vestas leads in internationalization, with a presence in 34 markets. Nordex-Acciona (27), Enercon (23), and Siemens Gamesa (21) also show strong international reach, although there is a visible shift back to core markets—especially in the case of GE, with “only” 13 markets.
The top four OEMs by volume according to GWEC are Chinese (Goldwind, Envision, Mingyang, Windey). The fifth is Vestas.
Goldwind is the most international among the Chinese OEMs (14 markets), followed by Envision with 9.
▶ On wind turbine technology:
The average capacity of new wind turbines has reached 5.5 MW, a 9% increase compared to 2023.
Onshore turbines have surpassed 5 MW on average for the first time. For offshore, the average stands at 9.815 MW.
Rotors larger than 180 meters (onshore + offshore) are now the majority, with a 58.6% global share in 2024 (vs 42.9% in 2023). This is surely driven by the gigantic onshore rotors being installed in China.
Geared drivetrains (both medium- and high-speed) represent 91.3% of the market.
There’s growth in medium-speed (hybrid-drive) turbine technology, with a 29.1% market share in 2024 (vs 25.0% in 2023). This shift is led by Goldwind, whose latest models use medium-speed drivetrains, now accounting for 89% of its installations.
Thank you very much for reading Windletter and many thanks to Tetrace, RenerCycle and Nabrawind our main sponsors, for making it possible. If you liked it:
Give it a ❤️
Share it on WhatsApp with this link
And if you feel like it, recommend Windletter to help me grow 🚀
See you next time!
Disclaimer: The opinions presented in Windletter are mine and do not necessarily reflect the views of my employer.